Introduction
Traceroute (tracert on Windows, Traceroute on Mac/*Nix) is one of the most commonly used, and often misunderstood, tools in the network troubleshooting toolkit. The good news is, this article will help set things straight so you can properly understand and diagnose connection problems in a Traceroute output.
A quick Traceroute history & how it works
Traceroute was written in 1987 by Van Jacobson as a way to display the path/route, alongside the route’s latency at each hop (or device) across an IP network.
Before we get into the how, we need to get into the why. There’s a network mechanism for IP packets that limits how long data can stay on an IP network. This mechanism is called time to live (TTL).
Think of this like an expiration date on your IP packet. Each packet of data your computer sends out contains that TTL metric. Every hop that packet of data (such as your ISP’s router) makes, the TTL metric will be decreased by 1. Eventually, that number reaches 0.
What happens then? At that point, the “hop” responsible for decrementing that number and reaching 0 will drop the packet and send an ICMP (Internet Control Message Protocol) message back to the source device. It will say something like “Expiration date reached!”
If we didn’t have this option, there would be an endless stream of packets out there circulating with no logic to discard them causing traffic issues and network congestion.
How Traceroute measures latency and records a path
It’s this TTL mechanism that Traceroute uses to measure the latency and record the path. Traceroute does this by sending out what’s known as probes. The TTL metric starts by sending 3 packets/probes with a TTL of 1.
A TTL of 1 means that the first network hop that the packets hit will be responsible for decreasing the TTL to 0 and dropping the packet. The Traceroute application, knowing the original probes were sent, will be listening for the message generated by the router that decremented that TTL to 0. It will then record the round-trip time (RTT) of each probe and display it on the first line of the output.
Then, Traceroute sends 3 new probes with a TTL of 2. This way, the packets traverse the first network device, get the TTL decreased to 1, and the second network device in the path does exactly what the first network device does—discards the packet and sends the TTL exceeded message back to the source of the Traceroute.
The Traceroute application does this down the line until either the destination has been reached, a “Destination Unreachable” message gets generated, or the default TTL max for the operating system has been reached. The TTL max metric varies from platform to platform.
Common Traceroute misinterpretations
The situations outlined below are the most common missteps one can take when interpreting a Traceroute output. This isn’t an exhaustive list by any means, just meant to help show a few big ones.
Situation #1: Traceroute output shows no responses past a certain hop
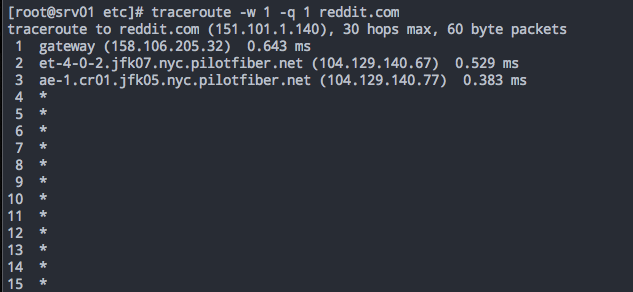
Incorrect interpretation: Routing is broken at or past that hop. Call the ISP.
Actual issue: The destination does not respond with the “Destination Unreachable” message, which causes the Traceroute application to continually increment TTL+1 messages until reaches the operating system’s max. The most likely reason for this is due to the destination’s security policy which effectively blocks Traceroute from working. Try not to conflate this issue with an application/website being broken. If you’re getting no response from the Traceroute output, it’s helpful to keep in mind that it’s just one option.
Situation #2: The Traceroute output shows 0 responses
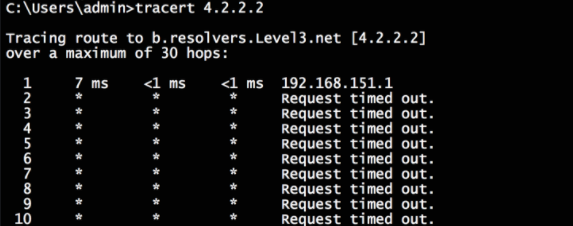
Incorrect interpretation: I have no internet connectivity. Call the ISP.
Actual issue: Your network administrator is either blocking the inbound “TTL Exceeded” messages from reaching the Traceroute application or blocking certain UDP. This prevents Traceroute from displaying proper information. Some firewalls are heavy-handed with their approach to default inbound rules so it’s always a good step to ensure that feature is enabled.
Situation #3: Traceroute output shows multiple router names on the same output line
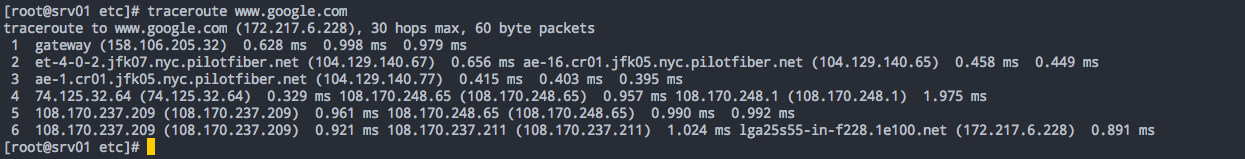
Incorrect interpretation: What is even going on with this network?
Actual issue: This is entirely normal. Some networks—as a way to ensure they have a resilient backbone—deploy load-balancing or Equal-Cost Multipath (ECMP). This means they use two links to balance their outbound traffic rather than one. In this situation, load balancing is calculated based on a source-destination port and IP address.
Refer to the example above, where 3 probes were generated for each “wave” of the Traceroute application. The router responsible for load balancing sees 3 inbound requests from the source and sends each probe over each leg of the path to balance the traffic. Now you’ll have each successive router in the path generating the “TTL Exceeded” messaging. The path from the first router is a hop or two different from the router with the first LB link. What matters most is when the destination sends the “Destination Unreachable” message.
Pro tip: This issue is only prevalent on devices that employ a UDP-based Traceroute. Windows, for example, uses ICMP echo requests/replies as a way to track the path and measure latency. Since ICMP does not use ports, the load-balancing router sees 3 connection requests from the same device and keeps it on one leg of the load-balanced link. To get around this issue on UDP-based Traceroute systems, use the -Q (query flag) 1 to ensure you only send 1 probe per hop. That also checks that your destination port is the same and will not be load-balanced over each link. If you want to go a step further, a program called Paris Traceroute can identify multipaths in modern networks.
Situation #4: Traceroute output shows packet loss in the path

Incorrect interpretation: There is packet loss on a remote network. This is affecting production traffic. Call the ISP’s ISP.
Actual issue: There is a difference between packets carried to a router’s control plane and packets carried through its data plane. Each TTL exceeded message gets generated by each router in the hop. A protection mechanism for these routers is to rate-limit how much traffic gets sent to it to prioritize all the other tasks it’s handling (BGP updates, SPF calculations). In the example, see how hop 8 (the actual destination) has 0 packet loss reported? That’s the difference between to and through.
Now imagine combining this with situation #1 from above? Imagine if hop 8 never sent a destination unreachable message and only displayed a 90%+ loss on the last response. This very thing is why many support tickets get created globally, just for that issue.
Situation #5: Traceroute output actually indicates there is a problem
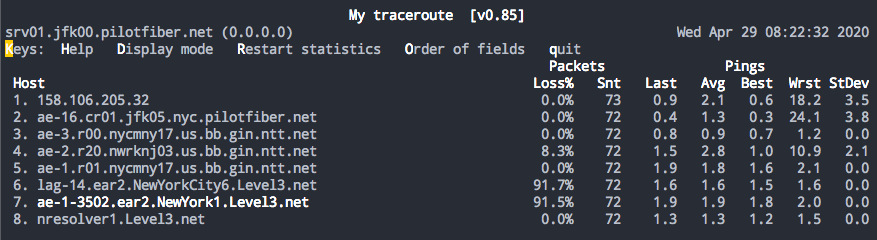
Incorrect interpretation: Using the Traceroute example in situation #4, imagine the loss gets carried to the destination and hop 8 results in 90%+ packet loss similar to hop 6 and 7. That would assumably indicate that there is an issue on level 3’s network causing the loss but that may not be entirely true. This demonstrates the systemic issue with Traceroute: It can only show the forward path. In order to fully know whether or not the packet loss is occurring on the forward path on level3’s network we’d have to also check the reverse path since the route/hops in the reverse path may differ from the forward path.
Actual issue: The problem is that there may be a return path issue using a completely different network than the one shown in the forward path—and that may be the network with the issue. The issue can become exponentially harder to troubleshoot without having a return Traceroute. Always try and get the forward and return Traceroute outputs to nail down an issue.
Conclusion
Although the situations outlined in this article are common, there are more caveats to using Traceroute to successfully identify an issue. Remember, it’s one of many tools in your kit to diagnose network issues.
More recommended reading
- Richard A Steenbergen’s NANOG presentation: A Practical Guide to (Correctly) A Practical Guide to (Correctly) Troubleshooting with Traceroute
- Don’t Trust Traceroute (Completely)
- Digital Ocean: How To Use Traceroute and MTR to Diagnose Network Issues
- How-To Geek’s Traceroute guide
- Paeesler’s “What you need to know about Traceroute”
- Use and Limits of Traceroute - Caren Litvanyi
- Keycdn - Traceroute command
- Cachefly - Understanding Traceroute